FIG. 1.
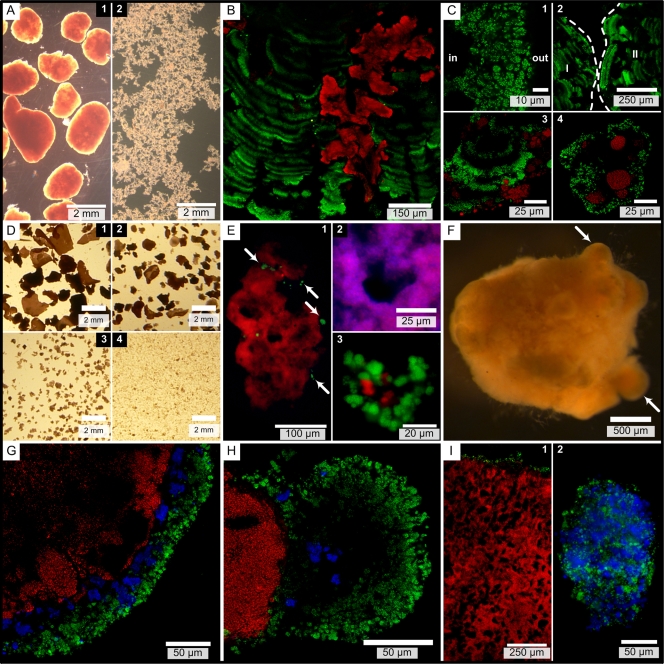
Micrographs of biomass from reactors A (A to C), B (D to E), and C (F to I). In the FISH images, AerAOB (with probes Nso1225 and Nso190) are green, Nitrospira spp. (with probe Ntspa662) are blue, and AnAOB (with probe Amx820) are red. FISH micrographs were acquired with a confocal laser scanning microscope (B, C, G, H, and I.1) or an epifluorescence microscope (E and I.2). (A) Two size fractions in biomass from reactor A. (B) Granule with pleomorphic AnAOB zones embedded in parallel AerAOB bands. (C.1) AerAOB rim with the granule core to the left (indicated by “in”). (C.2) Different directions of parallel AerAOB bands in cosectioned granules (granules I and II, indicated by dashed lines). (C.3) Parallel AerAOB bands in OLAND biofilm. (C.4) Floc with AerAOB and AnAOB microcolonies. (D) Four size fractions in biomass from reactor B. (E.1) Large aggregate with some AerAOB microcolonies (arrows) on the AnAOB core. (E.2) Anoxic void with AnAOB and all cells (DAPI, blue) (red + blue = magenta). (E.3) Floc with AerAOB and AnAOB microcolonies. (F) Reactor C granule with lobate extrusions (arrows). (G) Three-layer granule stratification with AerAOB, Nitrospira spp., and AnAOB. (H) Lobate granule extrusion. (I.1) Ubiquity of anoxic void spaces. (I.2) Floc with AerAOB and NOB microcolonies.

