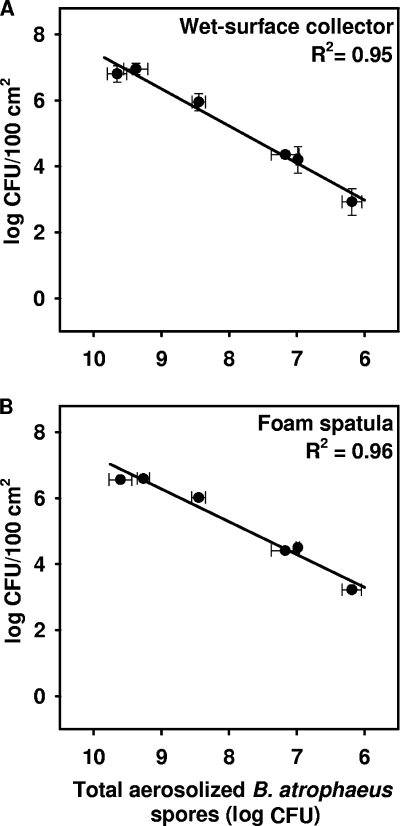
FIG. 1.
Linear regression analysis of the correlation between the numbers of B. atrophaeus spores collected in wet-surface collectors (A) and swabbed from glass surfaces using foam spatulas (B) and the total number of spores aerosolized within the test chamber. The number of viable spores was estimated after 16 h of settling in still air. Data points are shown as the mean log values (± SD [error bars]) per 100-cm2 area. Linear regression coefficients (R2) are shown in the upper right corner of each graph.

