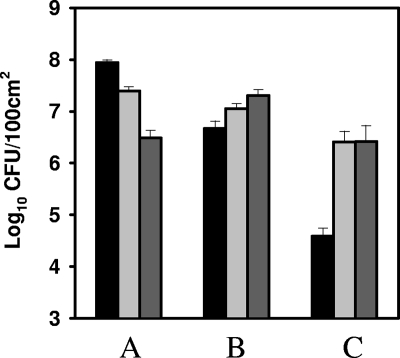
FIG. 4.
Comparison of the numbers of culturable P. agglomerans cells and bacterial cells that were stained by using a Live/Dead Bac Light bacterial viability kit that were present on glass surfaces 1 h after aerosolization. The three sets of bars show the theoretical surface load with P. agglomerans cells (A), the number of P. agglomerans cells in wet-surface collectors (B), and the number of P. agglomerans cells recovered with foam spatulas from glass surfaces (C). The numbers of culturable organisms (black bars), P. agglomerans with intact cell membranes (fluorescent green) (light gray bars), and P. agglomerans with damaged cell membranes (fluorescent red) (charcoal bars) are shown. The bars are shown as the mean log values (± SD) per 100-cm2 area.

