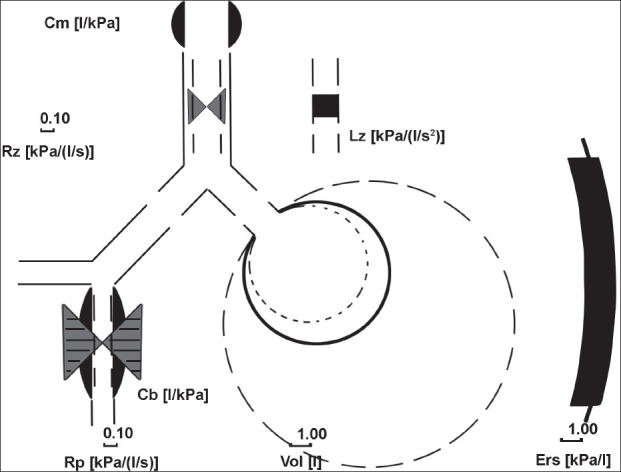
Figure 1.

Interpretation graph (model of lung) of a patient showing oropharyngeal compliance Cm, central component with central airway resistance Rc, central inertance Lz, bronchial compliance Cb, peripheral component with peripheral airway resistance Rp, lung compliance Cl, and thoracic wall compliance Cw. Cm (upper airway influence) shown is prominent
