
Figure 1.
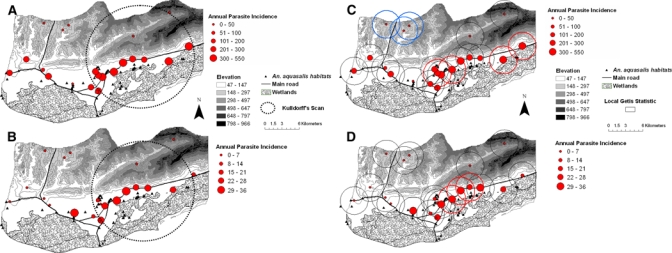
Annual parasite incidence (API: cases × 1,000/year-person) per village during 2002 (A, C) and 2007 (B, D) in Cajigal Municipality, northeastern Venezuela. Encircled areas in (A) and (B) denote significant clusters of diseases as detected by the Kulldorff scan statistic (P < 0.001). Encircled localities in (C) and (D) show the result of Gi*(d) analyses at a distance of 1 km, with significant (Gi*[d] > 2.79, P < 0.05) clusters of malaria infection in bold solid lines (hot spots, C, D) and broken lines (cold spots, C). Note the scale difference between API 2002 (A, C) and API 2007 (B, D). This figure appears in color at www.ajtmh.org.