
Figure 4.
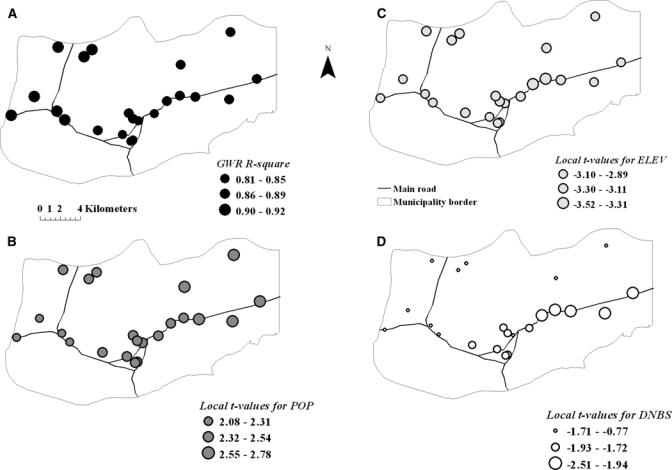
(A) Spatial variation of local R2 values or percentage of malaria persistence explained by local GWR models during 2002. (B) The t values of regression coefficients for population (POP), (C) elevation (ELEV), and (D) distance to the nearest breeding site (DNBS) in the local models.