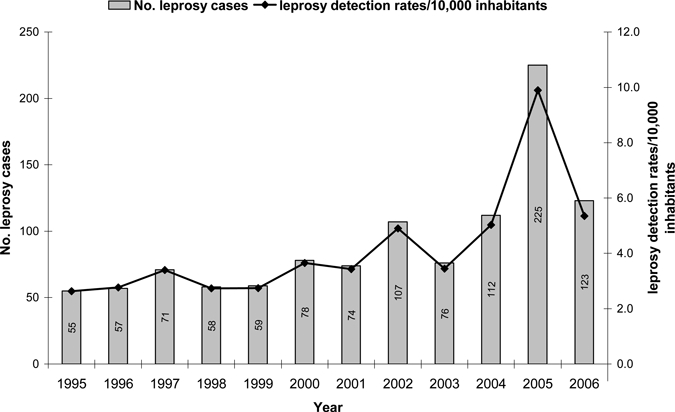
Figure 2.

Time series of Hansen's disease cases and the average detection rate per 10,000 people for the city of Mossoró (1995–2006). The graph shows an increase of Hansen's disease cases peaking in 2005. This peak of detection was a result of active surveillance in the area.
