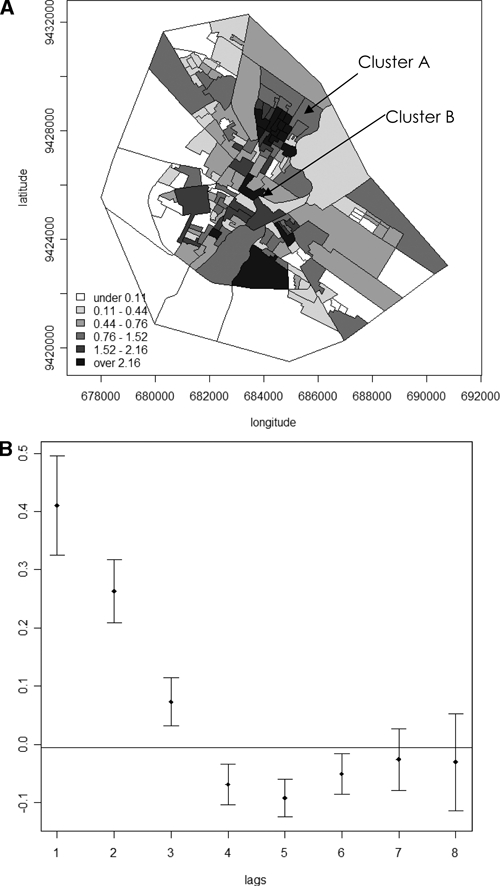
Figure 4.

A, Map of relative risk (RR) of Hansen's disease and clusters A and B as determined by the scan statistics Kulldoff's method. B, Moran's correlogram of the RR of Hansen's disease in Mossoró. The correlogram with the Moran's I of the RR and confidences interval are shown in the Y axis. Note that there are high autocorrelations in low lags with high decrease characterizing spatial autocorrelation.
