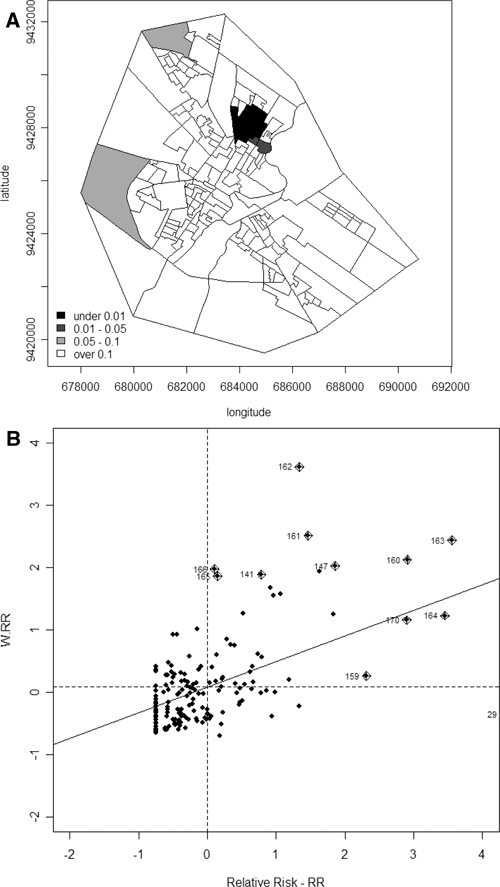
Figure 5.

A, Map of the P values (local P value for Moran I) related to the hypothesis tested of no association around each tract. In this map a dark region can be observed, which is the cluster A shown in Figure 4A. Although this cluster resembles cluster A shown in Figure 4A, the cluster B of the same figure cannot be shown by local indicator of spatial association (LISA) because the cluster B is formed by only one tract and therefore it does not present strong association with its neighboring tract. B, Moran scatterplot shows the tracts that present significant association with the neighboring tract. The tracts that are outliers may be easily visualized as points further then two units away from the origin, which are shown in Figure 5A, dark black.
