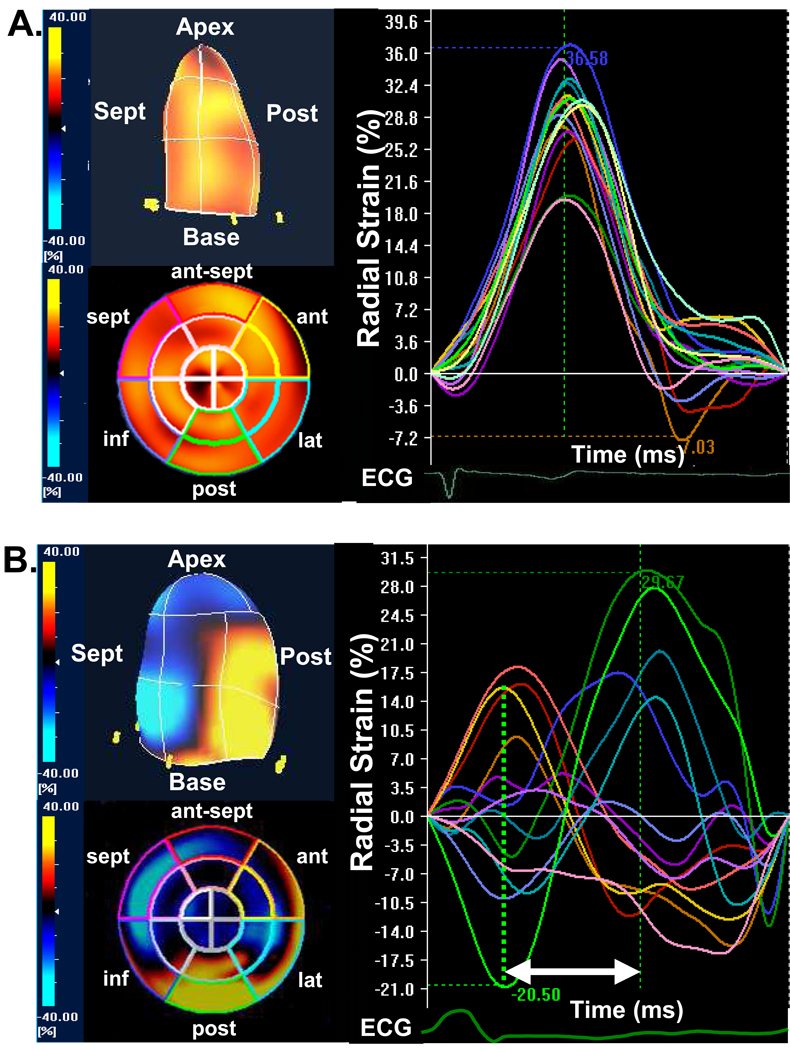
Figure 3.
(A) The color-coded 3-dimentional (3-D) left ventricular display (top left) and bull’s eye plot image (bottom left) and corresponding time-to-strain curves from 16 left ventricular sites (right panel) from a normal control, demonstrating synchronous tome-to-peak strain curves represented by homogeneous coloring at end-systole. (B) The color-coded 3-D left ventricular display (top left) and bull’s eye plot image (bottom left) and corresponding time-to-strain curves from 16 left ventricular sites (right panel) from a heart failure patient with left bundle-branch block, demonstrating dyssynchronous tome-to-peak strain curves represented by heterogeneous coloring at end-systole, with early peak strain in septal segments and delayed peak strain in posterior lateral segments (arrow). ant = anterior, ant-sept = anterior-septum, ECG = electrocardiogram, inf = inferior, lat = lateral, post = posterior, sept = septal.

