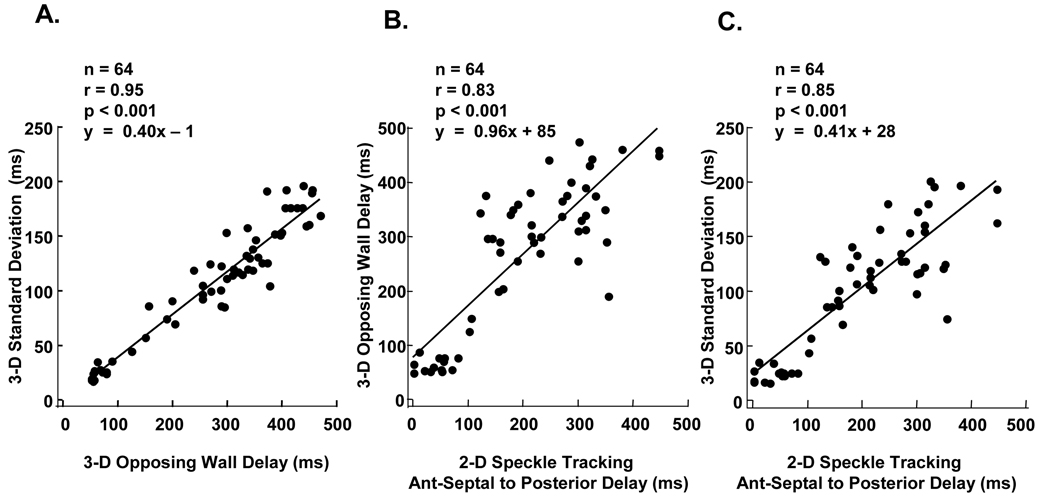
Figure 4.
(A) Dot plots of 3-dimensional (3-D) speckle tracking measures of maximum opposing wall delay to 3D 16-segment standard deviation in 64 subjects demonstrating a linear relationship. (B) Dot plots of 2-dimensional (2-D) speckle tracking dyssynchrony by anteroseptal (Ant-Septal) to posterior wall delay versus 3-D speckle tracking measures of maximum opposing wall delay and (C) 16-segment standard deviation demonstrating overall significant correlations.

