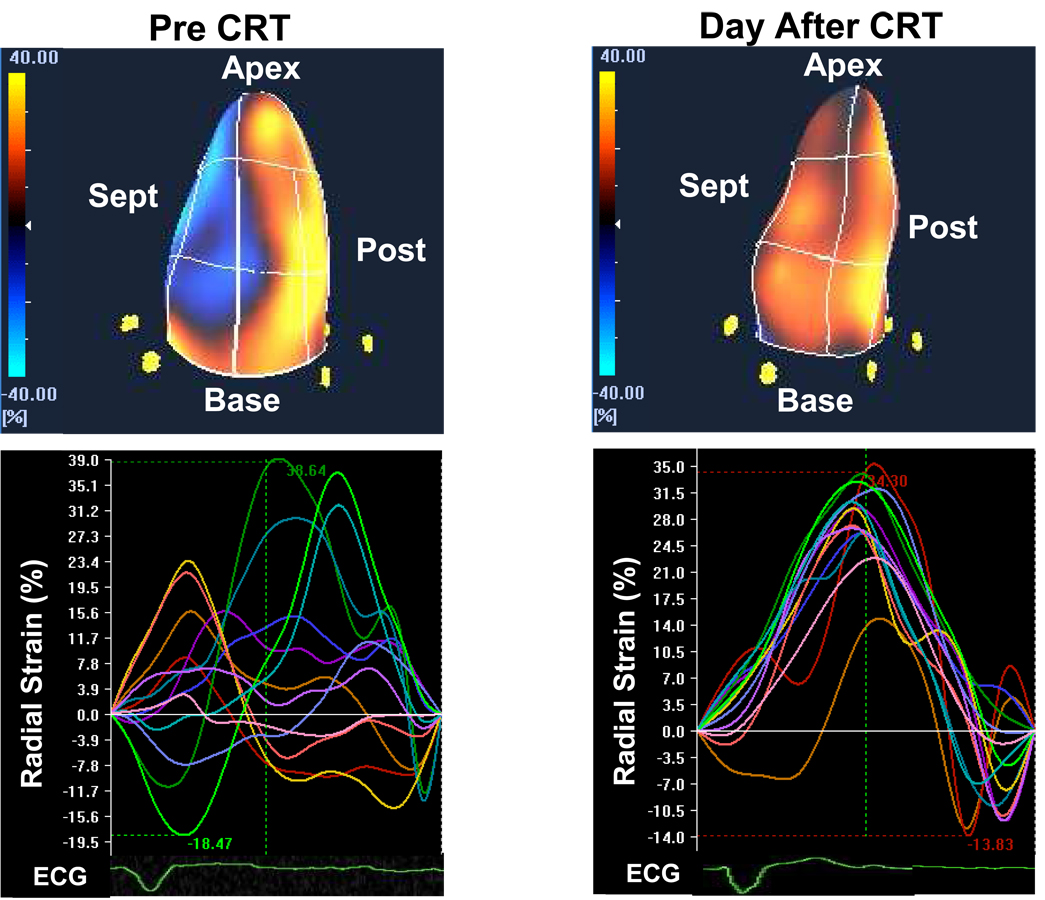
Figure 6.
Examples of color-coded 3-dimensional left ventricular displays (top panels) and time strain curves (bottom panels) in the same patient before (left) and the day after (right) cardiac resynchronization therapy (CRT), demonstrating acute improvement in left ventricular synchrony. ECG = electrocardiogram, post = posterior, sept = septal.

