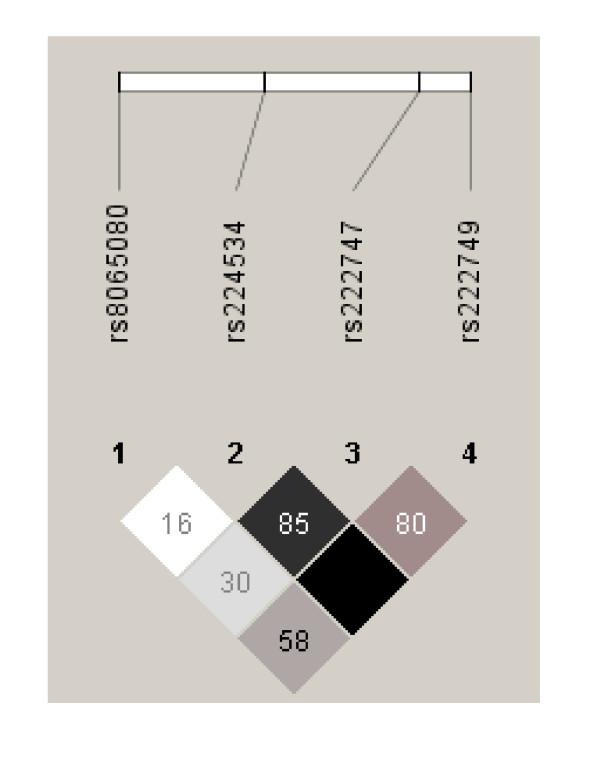
Figure 3.
LD plot D'/LOD. Linkage disequilibrium (LD) plot across the TRPV1. The box at the top indicates the TRPV1 gene with the 4 investigated SNP's. The LD plot is based on the measure of D'. Each diamond indicates the pair wise magnitude of LD, with dark grey diamonds indicating strong LD (D' > 0.8) and light grey: uninformative. LD: linkage disequilibrium is the non-random association of alleles at two or more loci, not necessarily on the same chromosome. Linkage disequilibrium describes a situation in which some combinations of alleles or genetic markers occur more or less frequently in a population than would be expected from a random formation of haplotypes from alleles based on their frequencies.

