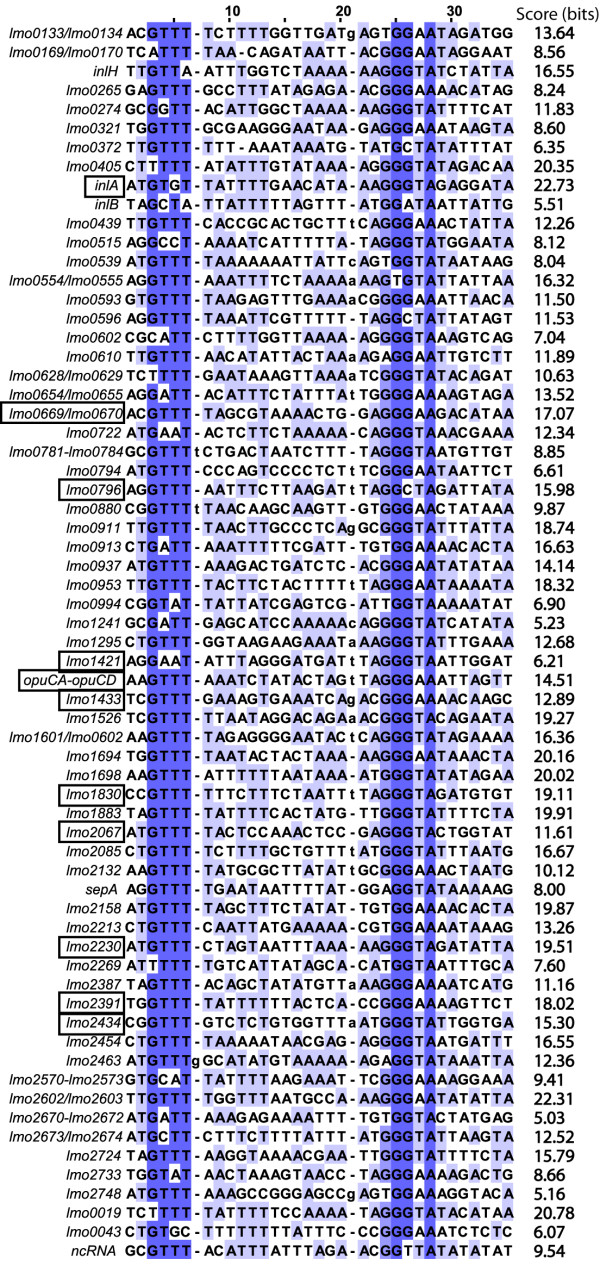
Figure 7.
Alignment of the 65 putative σB-dependent promoters identified in this study. EGD-e homologs of genes or operons downstream of a given promoters are indicated on the left. Positions 3 to 6 in the alignment represent the -35 region while positions 24 to 29 represent the -10 region. Darker nucleotides are more conserved than lighter nucleotides in the alignment. Gene names that are boxed indicated promoters that have been experimentally validated (e.g., by RACE-PCR).

