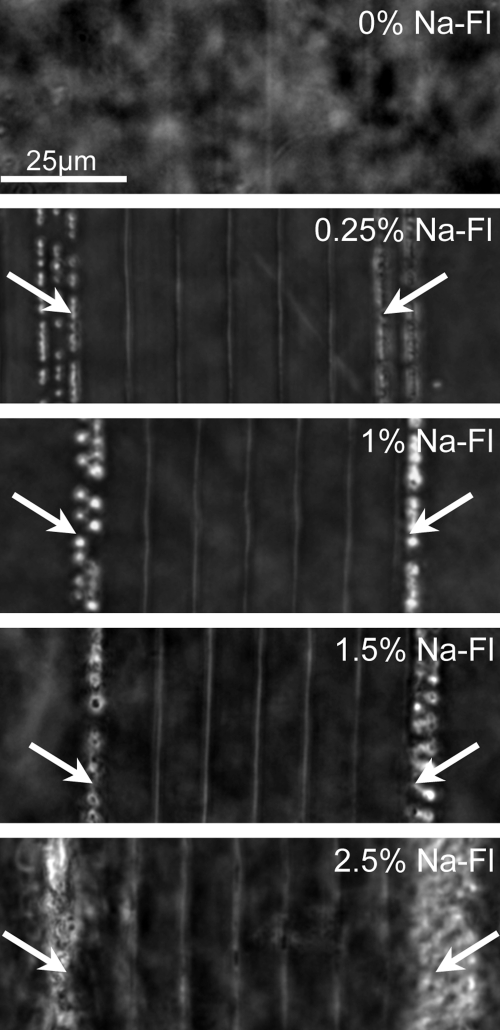
Figure 3.
DIC photomicrographs of IRIS lines created at 0.1 mm/s (outer lines; arrow) and 2 mm/s (inner five lines) in living corneal tissue doped with different concentrations of Na-Fl in preservative solution. In undoped cornea (0% Na-Fl), the IRIS lines were barely visible, even at 0.1 mm/s, suggesting little or no RI change. By increasing the TPA of the tissue with Na-Fl doping, significant and visible RI changes were induced at high scanning speeds (such as 2 mm/s). However, low scanning speeds (0.1 mm/s) caused plasma luminescence and bubble formation (arrow).

