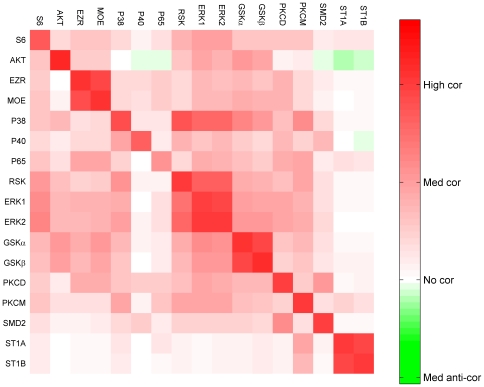
Figure 1. Heat-map of the correlation matrix between the input and the output variables.
The rows and columns correspond to inputs and outputs, respectively. Negative values of the correlation are small in magnitude (e.g., AKT to P40) compared to positive values of the correlation. Hence, to enhance the visualization, asymmetric color-scale is used.

