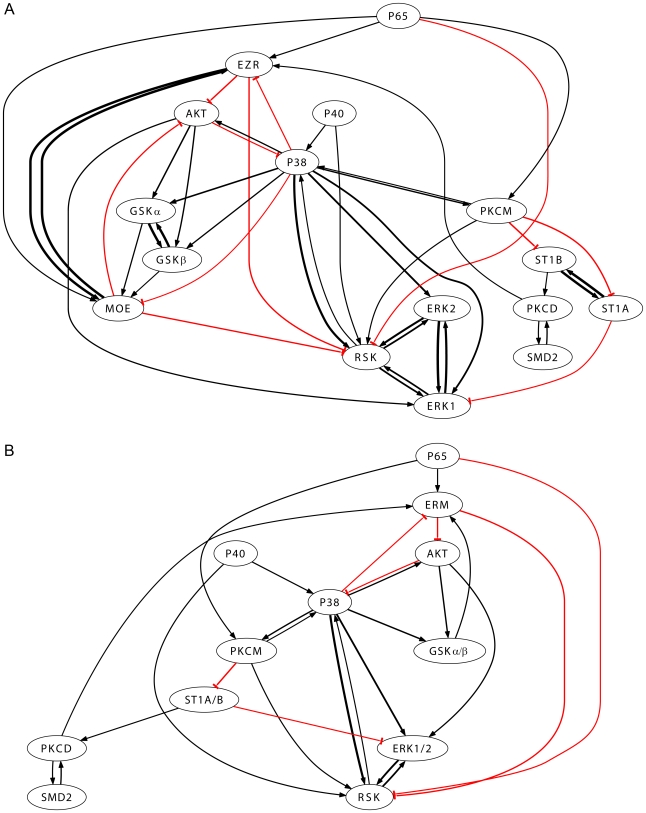
Figure 4. Reconstructed phosphoproteins signaling network in RAW 264.7 macrophages.
(A) Full network with 16 phosphoprotein nodes. Activation and inhibition are shown with black (arrow end) and red (blunt end) lines, respectively. Thickness is proportional to (square root of) the confidence in that interaction. (B) Short network after combining ERK1 and 2, GSKα and β, ST1A and B, and EZR and MOE in single node. To do so, the corresponding rows and columns in the matrix of significant ratios were averaged without any ambiguity in the signs of the incoming or outgoing edges.

