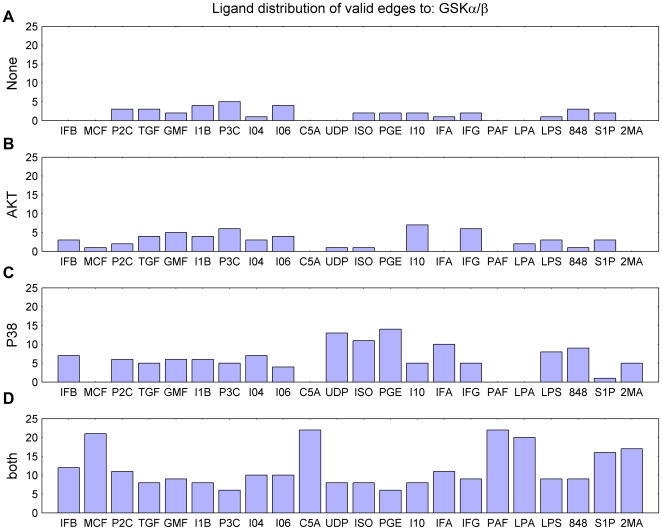
Figure 7. Ligand distribution for all four cases of GSKα/β activation (discussed in Figure 5B).
X-axis and Y-axis represent the name of ligand and counts of the cases, respectively. For dual ligand experiments, the case is added to both of the ligands. The panels A–D also correspond to the heat-maps of Figure 6 A–D, respectively.

