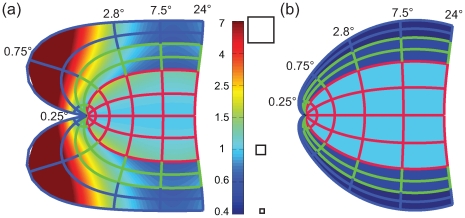
Figure 4. Meridional anisotropy.
Values smaller than 1 (dark bluish colors) indicate that magnification is smaller compared to the horizontal meridian in V1. Values larger than 1 (reddish colors) indicate a larger magnification. (a) The Log-Polar model suggests large amounts of meridional anisotropy. In particular it suggests up to 7 times the magnification for V3 as for V1. (b). The Double-Sech model predicts rather simple patterns of meridional anisotropy. Essentially, it predicts a constant anisotropy for each retinotopic area (i.e. no change of meridional anisotropy within an area). The amount of anisotropy for a given area is simply determined by the α parameter. V3 has a meridional anisotropy of 0.4 (determined by α3 = 0.4).

