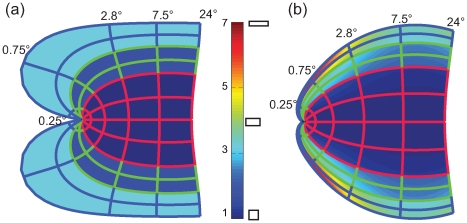
Figure 5. Local anistropy.
(a) The classical Log-Polar transform predicts a simple pattern of local anisotropies. Here α directly determines local anisotropy, α3 = 0.4, resulting in a local anisotropy of 2.5 (1/α3). (b) The Double-Sech model predicts a more complicated pattern of local anisotropy, suggesting fairly large degrees of local anisotropy, especially near the V3 foveal projection.

