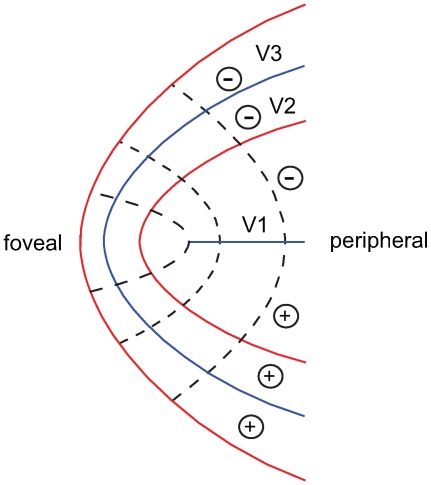
Figure 7. Canonical layout of the foveal confluence.
This layout is derived from data [3]. Dotted lines depict isoeccentricity contours, red lines - vertical meridian and blue lines horizontal meridian representations. Empirical data suggest that V2 and V3 do not come to a point but form bands surrounding the foveal tip of V1. Plus and minus signs signify representations of the upper and lower visual field.

