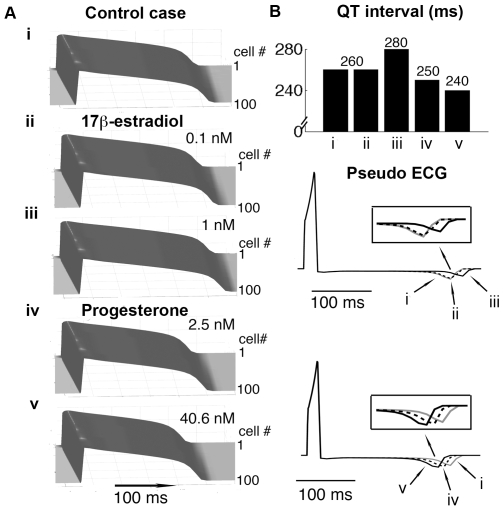
Figure 3. Predicted effects of sex hormones on cardiac tissue and QT-intervals.
Action potential (50th paced beat at 1000 ms pacing frequency) propagation from top (cell# 1) to bottom (cell# 100) in a 1 cm cardiac fiber is shown. Time is on the x-axis and voltage on the z-axis. (A) Application of E2 and progesterone (i): control case (no E2), (ii): 0.1 nM E2, (iii): 1 nM E2, (iv): 2.5 nM progesterone, and (v): 40.6 nM progesterone. (B) Comparison of QT intervals is shown in top panel. Lower panels are pseudo ECGs showing the effect of hormones on QT intervals for different cases. The corresponding T-waves are indicated.

