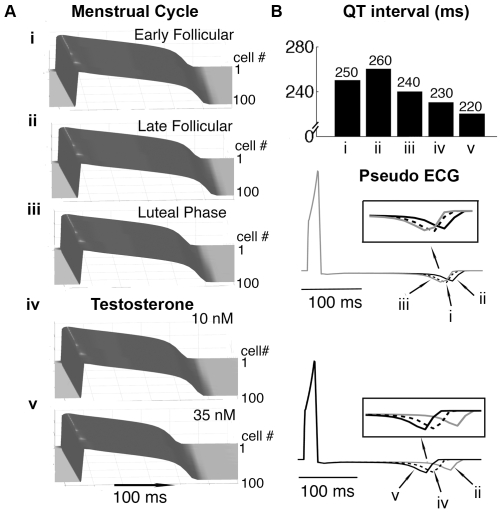
Figure 4. Simulated combined effects of female hormones during the menstrual cycle and male hormones on cardiac action potentials.
Shown is the 50th paced beat at a cycle length of 1000 ms in 1D cables. (A) (i): Early follicular phase (ii): Late follicular phase (iii): Luteal phase. Simulated APD in the presence of two physiological concentrations (iv and v) of testosterone. (B) The computed virtual electrograms show QT intervals change during various stages of menstrual cycle and at two concentrations of testosterone (lower panels). The vertical bar graph shows the QT intervals under different circumstances (top panel).

