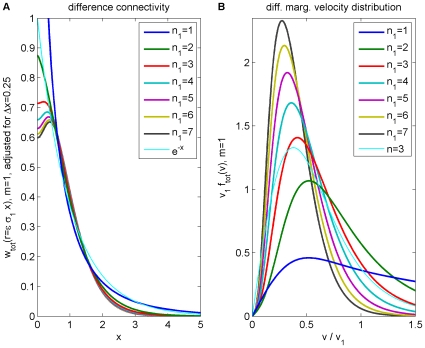
Figure 3. Difference propagator: synaptic connectivity and marginal velocity distribution.
This figure is like Fig. 1, but for the difference propagator with  . (A) Synaptic connectivity fit to an exponential decay (thin curve), Eqns. (47) and (49) are used. (B) Marginal velocity distribution Eq. (51). The dispersive
  case is shown as thin curve for comparison.

