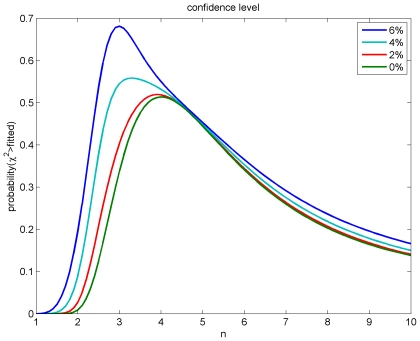
Figure 4. Confidence levels obtained from fits to the data in Tab. 2.
The power  of Eq. (54) was varied in steps of 0.1 for four different uncertainties of the observed threshold diameters
  . The assumed relative diameter error reflects mainly differential shrinkage. As confidence level the probability that
  is greater than the fitted
  is shown.

