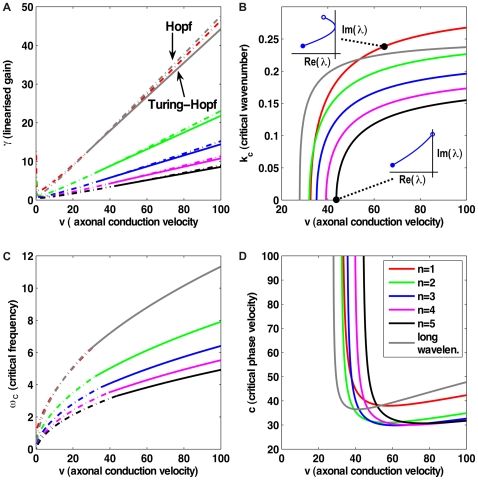
Figure 9. Turing instability analysis of the dispersive and long-wavelength propagators.
Bifurcations are investigated by varying the axonal conduction velocity  and determining
  ,
,  , and the critical linearized gain
  . All other model parameters remain at the values discussed in the text. (A) Solid curves represent Turing-Hopf bifurcations (
 ), dot-dashed curves Hopf bifurcations (
 ). Results for orders
  of the dispersive propagator and for the long-wavelength model are shown. Above the Turing-Hopf curves travelling waves emerge, whereas above the Hopf curves bulk oscillations are seen. Stability will be lost at a given
  through the less stable bifurcation, which has smaller critical
  . (B) Critical wavenumber
  of the Turing-Hopf bifurcation. Insets show the position in the complex plane of the most weakly damped pole under variations of
  (open circles
  , closed circles
  ) for the dispersive model at the indicated
  . (C) Critical frequency
  of the less stable bifurcation. (D) Critical phase velocity
  , shown where Turing-Hopf is the less stable bifurcation.

