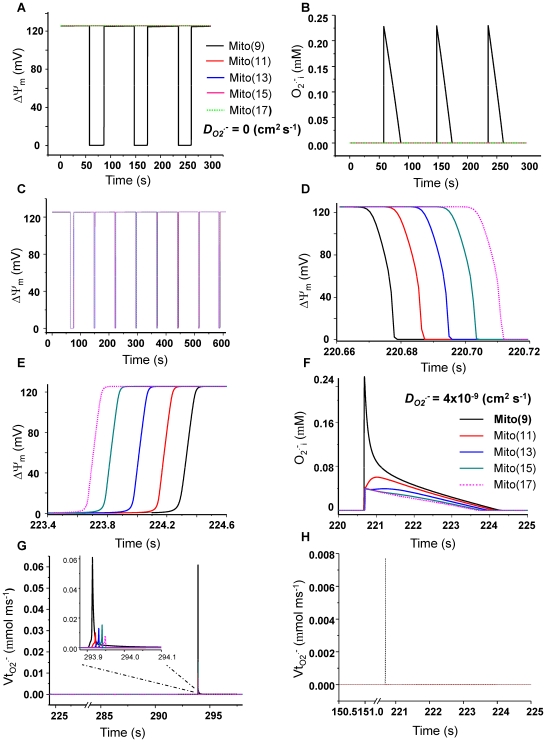
Figure 3. Spatial propagation of ΔΨm depolarization in non-oscillating mitochondrial networks using the 1D RD-RIRR model.
A network consisting of a row of 17 mitochondria was analyzed. The mitochondrion in the center (mito_9) was initialized with parameters within the oscillatory domain (shunt = 0.14) whereas the other mitochondria were within the nonoscillatory stable range of parameters (shunt = 0.02). etSOD was 1.45 µM for all mitochondria in the network. A and B) The dynamics of ΔΨm and O2 .− i without O2.− coupling through diffusion between mitochondria (i.e., D O2 .− i = 0). Mitochondria in the row are differentiated by colors, and only part of one side of the row is shown (i.e., from mito_9 to mito_17). C) ΔΨm dynamics in the presence of O2.− diffusion (D O2 .− i = 4×10⁻⁹ cm2 s−1). D and E) Expanded records of the third depolarization (D) and repolarization (E) waves spanning mito_9 through mito_17. F) Expanded record of O2.− during a repolarization wave showing the dynamics of O2 .− i in each mitochondrion (color coded) with mito_9 showing the highest amount of cytoplasmic O2 .−. G and H) The rate of O2.− release from mitochondria to the periplasmic space (Vt O2 .− i) in the network (G) or in an isolated mitochondrion (H). All other parameters were as described in [16] and also listed in the Supplemental Materials (Table S2).

