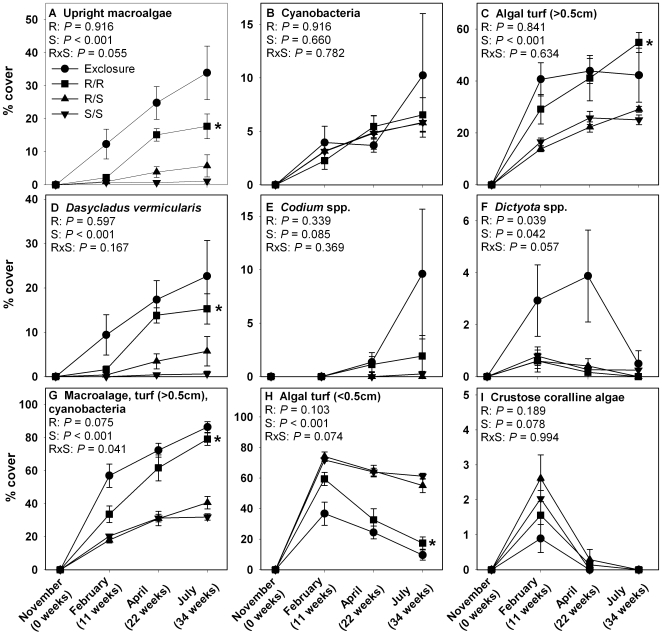
Figure 1. Percent cover (mean ± SE) of common algal types over time during Year 1.
R = redband parrotfish and S = ocean surgeonfish. Statistics are from repeated measures, two-factor ANOVA. * indicates a single-herbivore treatment that differs from the mixed-herbivore treatment as determined via resampling statistics. n = 8 for Exclosure, n = 6 for R/R, n = 6 for R/S, and n = 8 for S/S. Note different Y-axes.

