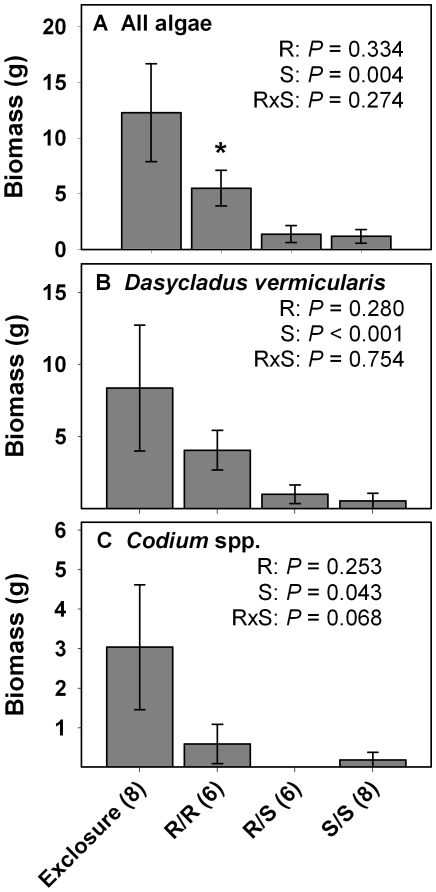
Figure 2. Biomass (mean ± SE) of algae at the end of Year 1.
Data are for (A) all algae, (B) Dasycladus vermicularis, and (C) Codium spp. Statistics are from two-factor ANOVA. * indicates that single- vs. mixed-herbivore treatments differ as determined via resampling statistics. Sample size is in parenthesis next to each treatment.

