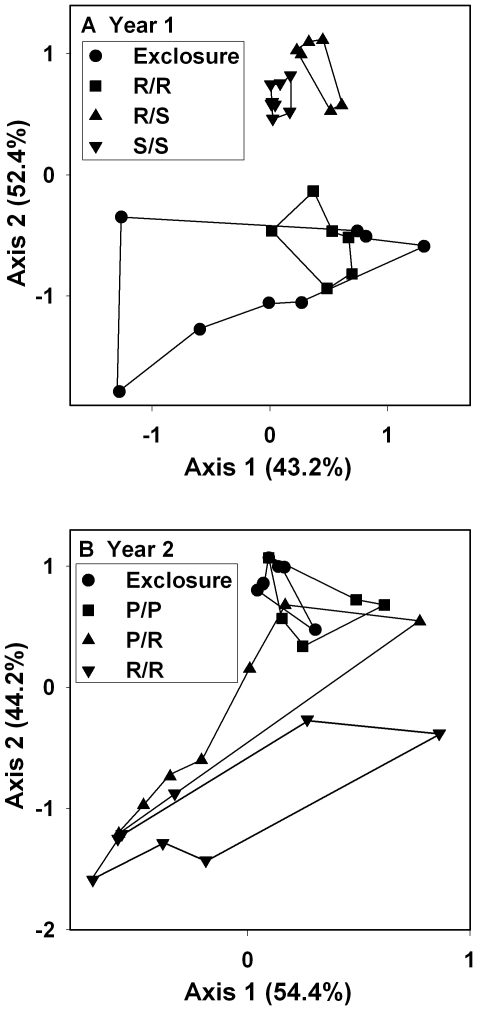
Figure 3. Plot of axes from nonmetric multidimensional scaling (NMDS) describing the similarity of the algal communities among the treatments.
Data are for (A) Year 1 and (B) Year 2. Values within parentheses show % of variance explained by each axis. Symbols are as in Fig. 1. Lines connect replicates within treatment.

