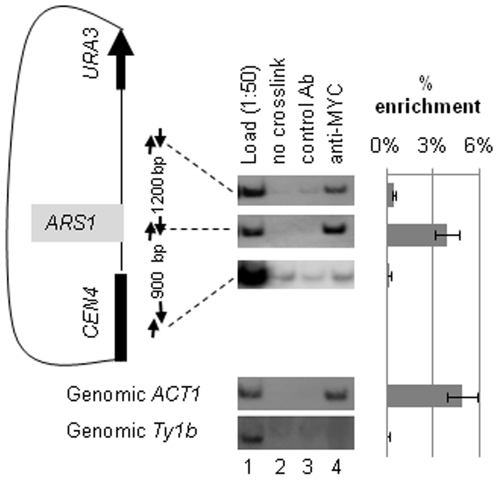
Figure 3. Gcn5p associates with mini-chromosomal ARS1.
A map of the test mini-chromosome (pARS1wt/linker) is shown on the left. The distance between ARS1 and URA3 is 2.2 kb. The distance between the PCR fragments is shown between the pairs of arrows. MYC-ADA3 cells harboring this mini-chromosome were cross-linked with formaldehyde and immunoprecipitated with anti-MYC antibodies. The precipitated DNA was quantified by PCR in triplicate. The per cent of signal from each fragment in the anti-MYC immuneprecipitate versus Load (diluted 1∶50) was calculated and plotted in the graph on the right together with the standard deviation in the three PCR reactions. Controls with genomic ACT1 and Ty1b DNAs are shown below the mini-chromosome diagram. A typical outcome of one of two independent experiments is shown.

