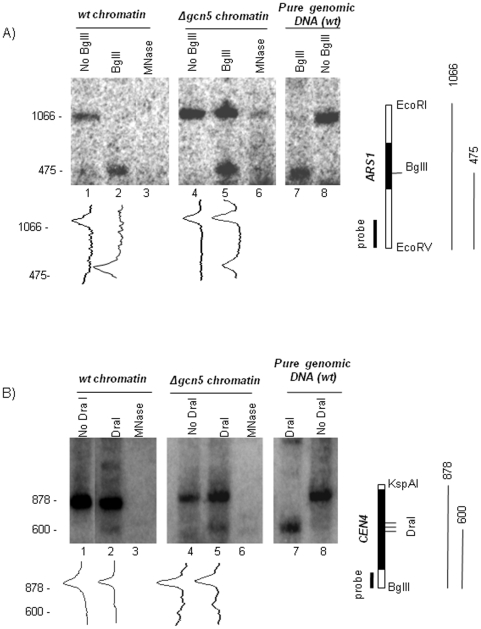
Figure 5. Chromatin structure of ARS1 and CEN4 in Δgcn5 cells.
Spheroplasts from Δgcn5 and the isogenic wild type cells (BY4741) were lysed and exposed to excess of BglII, DraI or MNase as indicated on top of each lane. After purification and complete digestion with restriction enzymes that cut at each side of the analyzed loci (shown on the right), DNA fragments were analyzed by Southern blot with the probes shown on the right. A typical outcome of one of three independent experiments is shown. A. Analysis of ARS1 . Diagram of the ARS1 locus on chromosome IV with the positions of ARS1, of the probe for Southern blot and of the BglII, EcoRV and EcoRI sites is shown on the right. The BglII-cleaved (475 bp) and uncleaved (1066 bp) fragments are also shown. Density graphs of lanes 1, 2, 4 and 5 are shown underneath. B. Analysis of CEN4 . Diagram of the CEN4 locus on chromosome IV with the positions of CEN4, of the probe for Southern blot, of the BglII and KspAI sites and the three juxtaposed DraI sites is shown on the right. The DraI-cleaved (600 bp) and uncleaved (878 bp) fragments are also shown. Density graphs of lanes 1, 2, 4 and 5 are shown underneath.

