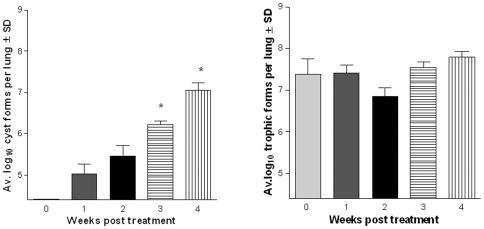
Figure 4. Cysts return after withdrawal of anidulafungin.
(Panel A) Average log cyst counts. Week 2 vs 0 wk. (*) P<0.05; Weeks 4, 6 vs 0 wk (**) P<0.001 (Panel B) Average log trophic counts. No significant differences among the groups when compared to time point “0”. Weeks 2 and 4 post treatment were significantly different (P<0.05). The biological significance of this difference is unknown.

