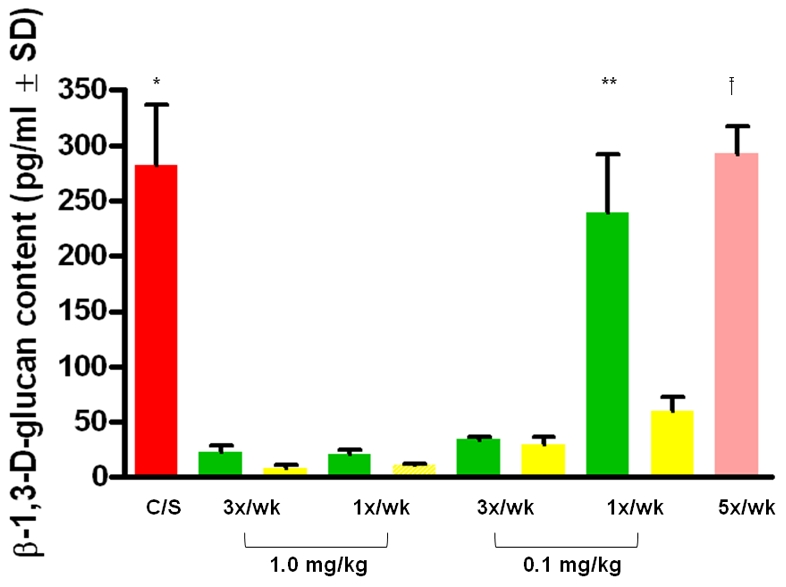
Figure 6. β-1,3-D-glucan in the lungs of mice treated prophylactically with echinocandins.

β-1,3-D-glucan contents in the lungs of treated and untreated mice and rats were quantified with the GLUCATELL™ kit. Red bar (C/S) = untreated, immunosuppressed mice; Green bars = anidulafungin; Yellow bars = caspofungin; Pink bar = prophylactic dose of TMP/SMX (12.5/62.5 mg/kg). Dose regimens are described on the X-axis. (*) The average of the untreated mouse group was statistically different (P<0.001) from all groups treated prophylactically except anidulafungin 0.1 mg/kg/1x/wk and the TMP/SMX prophylactically -treated mice. (**)The average of the mice prophylactically treated with anidulafungin 0.1 mg/kg/1x/wk was statistically different from all of the echinocandin-treated mouse groups (P<0.001) but not from the TMP/SMX treated or the untreated mice. (†) The mice treated prophylactically with TMP/SMX treated were significantly different from all of the echinocandin-treated mice except for anidulafungin 0.1 mg/kg/1x/wk and the untreated control group (P<0.001).
