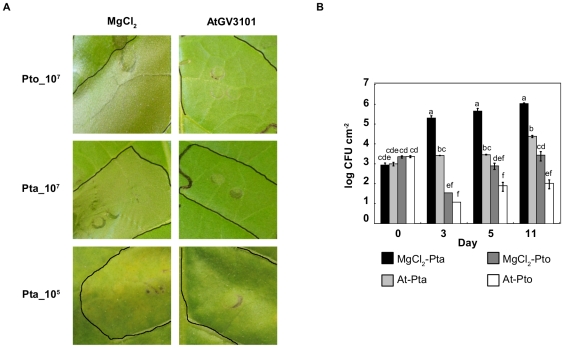
Figure 1. Agroinfiltration of N. tabacum leaves prior to P. syringae infection reduces macroscopic symptoms and P. syringae growth.
A. N. tabacum leaves were infiltrated with 10 mM MgCl2(AS) (MgCl2) or A. tumefaciens GV3101 (AtGV3101) at 107 cfu/ml. P. syringae pv. tabaci 11528 (Pta) and P. s. pv. tomato DC3000 (Pto) were infiltrated 48 hours later at 107 cfu/ml. Images show infiltrated areas from representative leaves photographed 24 hours after inoculation with Pta and Pto at 107 cfu/ml, (top panels) or 6 days after inoculation with Pta at 105 cfu/ml (bottom panels). B. N. tabacum leaves were inoculated with 10 mM MgCl2(AS) or AtGV3101 as described in A, followed 48 hours later by inoculation with P. syringae at 105 cfu/ml. Population densities of P. syringae were estimated at 0, 3, 5 and 11 days after inoculation by dilution plating of homogenised leaf extracts onto selective media. CFU, colony forming units; MgCl2-Pta, Pta population density after MgCl2(AS) treatment; MgCl2-Pto, Pto population density after MgCl2(AS) treatment; At-Pta, Pta population density after AtGV3101 treatment; At-Pto, Pto population density after AtGV3101 treatment. Data shown is the average of three replicates. Error bars show standard deviation. General Linear Model (GLM) analysis revealed statistical differences between treatments (F = 56.4244; p<0.0001; df = 15). Means with the same letter were not significantly different at the 5% confidence level based on Tukey's Honestly Significant Mean Differences (HSD) Test. The experiment was performed twice with similar results.

