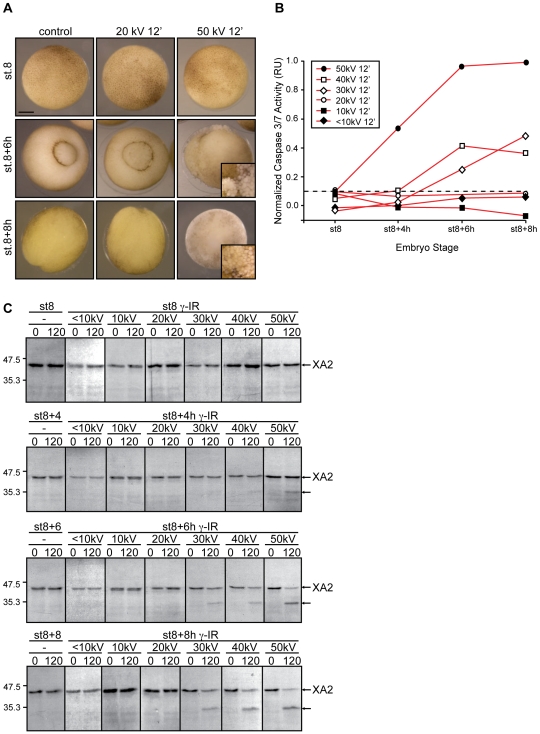
Figure 2. Apoptosis results from exposure to increased energies.
A. Morphology of Xenopus embryos that are non-irradiated (control) or irradiated (γ-IR) with either 20 kV or 50 kV for 12 min and collected at MBT (st.8) and 6 and 8 h after. Inset shows a higher magnification image of a typical apoptotic morphology from a similar embryo. Scale bar, 250 µm. B. Embryos were irradiated or not (control) before the MBT (st.6) with the indicated amount of energy (<10 kV, 10 kV, 20 kV, 30 kV, 40 kV, 50 kV) for 12 min, collected at st.8 (MBT) and 4, 6 and 8 h after the MBT, and frozen. At the indicated times, samples equivalent to ten embryos were tested for the activity of caspases 3/7 using a specific colorimetric substrate as described in the “Materials and Methods” section. Normalized caspase activity refers to the activity of irradiated samples from which the basal control activity has been subtracted at each time and is expressed in relative units (RU). Points indicate the average of ten embryos at each time stage. The figure shows data from a single experiment that was repeated three times with similar results. The dotted line denotes a threshold of caspase activity from which experimental values falling below correlate with embryo samples lacking an apoptotic response. C. Extracts equivalent to ten embryos collected at the indicated times were incubated with radiolabeled cyclin A2 as described in the “Materials and Methods” section. At the indicated times (0 and 120 min), aliquots were removed and analyzed for cyclin A2 cleavage by SDS-PAGE and autoradiography. Control samples correspond to non-irradiated embryos. Arrows on the right denote radiolabeled Xenopus cyclin A2 (XA2) and its cleaved form. Molecular mass markers (in kDa) are indicated on the left.

