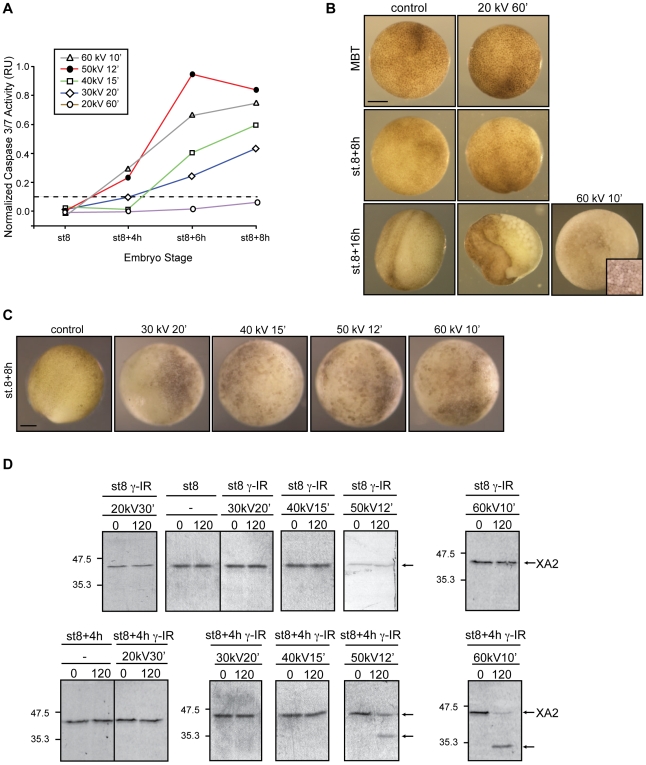
Figure 5. Xenopus embryos exhibit different biological responses to the same dose of radiation.
A. Embryos irradiated (γ-IR) or not (control) before the MBT were collected at the indicated energies and times as summarized in Fig. S2.C. Caspase activity was assayed as described in the legend of Figure 2. Points indicate the average of ten embryos at each time stage. Figure shows data from a single experiment that was repeated three times with similar results. B. Morphology of Xenopus embryos non-irradiated (control) or irradiated with 20 kV for 60 min and collected at MBT (st.8), st.8+8 h and st.8+16 h. For comparison, an embryo treated with 60 kV for 10 min and collected at st.8+16 h is displayed. Inset shows a higher magnification image of typical apoptotic morphology from a similar embryo. C. Morphology of Xenopus embryos non-irradiated (control) or irradiated with 30, 40, 50, 60 kV for 20, 15, 12 and 10 min, respectively, and collected 8 h after the MBT. Scale bar, 250 µm. D. Caspases 3/7 activity were also assessed by cleavage of the radiolabeled cyclin A2 in extracts from control (non-irradiated) or γ-IR with the same total dose as indicated. Arrows on the right denote radiolabeled Xenopus cyclin A2 (XA2) and its cleaved form.

