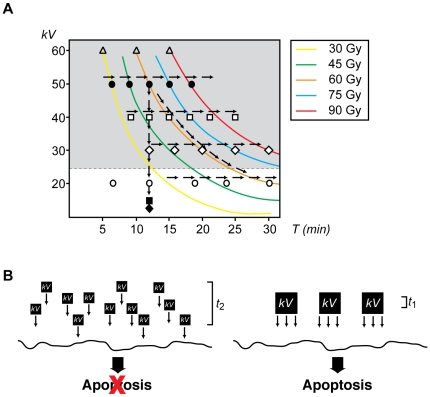
Figure 7. The energy-dependent model of the apoptotic response.
A. Summary of all experimental conditions analyzed in this work. Arrows indicate each of the three scenarios tested. Energy was measured in kilovolts (kV) and exposure time (T) in min. Colored lines indicate the same total exposure dose. Symbols indicate various energies tested: ⧫: <10 kV, ▪: 10 kV, ○: 20 kV, ◊: 30 kV, □: 40 kV, •: 50 kV, △: 60 kV. B. Conceptual model for the contribution of energy and exposure time to the induction of apoptosis. Energy (kV) is delivered to the sample in either small (left) or large (right) quantum packages. In our schematic representation, small packages are ¼ the size of the large ones, whereas the exposure time is four times longer (t2 = 4t1) in the model represented on the left, and thus, the total exposure dose is the same in both settings. In our model, apoptosis is exclusively induced when large packages of energy are delivered to the sample even when the total exposure dose is the same in both scenarios.

