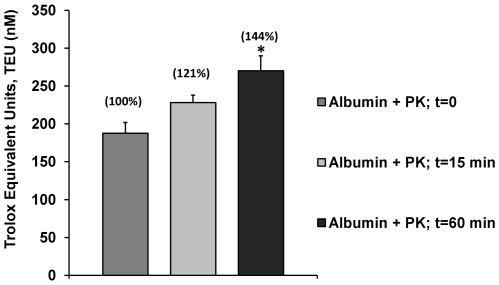
Figure 4. The effect of hydrolysis of albumin on Antioxidant Capacity (AC) and Response Surplus (RS).
The antioxidant capacity of albumin was increased with the hydrolysis procedure with Proteinase K (PK). However, the magnitude of the antioxidant capacity before 15 minutes and 60 minutes (total hydrolysis) of incubation with PK were only 1.2 and 1.4 times the combined original antioxidant capacity of albumin and PK without incubation (t = 0). The Antioxidant Capacity Accumulated (ACA %) appears above the bars and corresponds to 0, 15 and 60 minutes of incubation time respectively. RS values correspond to ACA % - 100 as specified in the Material and Methods section. Results are expressed as mean ± SD (n = 5). *P<0.05 vs. native albumin.

