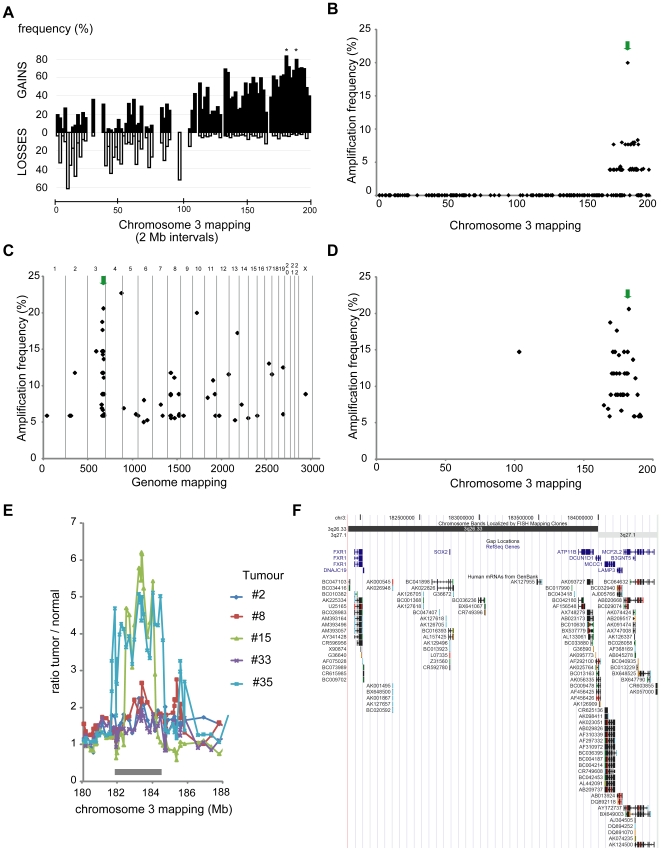
Figure 1. Characterization of chromosome 3 aberrations in lung SCC using array-CGH.
A. Frequency of chromosome 3 losses and gains in 26 advanced lung SCCs. For each 2 Mb interval along chromosome 3, frequencies were calculated by dividing the total number of occurrences of losses or gains observed in the series by the total number of possible occurrences, expressed as percentages and represented along the chromosomal order. Gaps are due to intervals with no coverage on the array. Frequent 3p losses seem to affect discontinuous zones. The most frequently lost region is the 8–10 Mb interval (around 60% of samples). Gains were more frequently detected on the 3q arm: 3q26-qter was gained in 50–60% of the samples with two discrete intervals (180–182 and 188–190 Mb, denoted by asterisks) gained in around 80% of tumors. B. High level chromosome 3 amplification frequency in 26 advanced lung SCCs. For a given clone, a ratio greater than 2 (1 in log2 scale) in a single experiment was considered to represent a high-level amplification. Frequencies were calculated for the series of 26 cases and plotted according to clone localization. High level amplifications cluster in the 3q26-qter region. A peak maxima is observed for BAC clone RP11-259I19; high level amplifications of this locus are found in 20% of cases (5/26 tumors). C. Whole genome high level amplification frequencies in 34 advanced lung SCCs (independent cohort). Chromosome numbers are indicated above the graph, and different chromosomes are separated by vertical gray lines. For a given clone, a ratio greater than 1.5 in log2 scale in a single experiment was considered to represent a high-level amplification. Frequencies were calculated for the series of 34 cases and plotted according to clone localization on the genome. Two genomic regions, on chromosomes 3 and 4 were amplified in >20% of the cases. D. High level chromosome 3 high level amplification frequency in 34 advanced lung SCCs (independent cohort). The graph corresponds to panel C restricted to chromosome 3. E. Individual array-CGH profiles obtained for the five tumors with high level 3q26.3 gene amplifications. High ratio deviations were observed for two tumors with straight amplicon boundaries (#15 and #35). The consensus region of 3q26.3 amplifications is a 2.7 Mb segment spanning the 181.9–184.6 Mb interval (denoted by a grey rectangle). F. UCSC genome browser map of the 3q26.33 consensus region of amplifications in lung SCCs. This fully sequenced and assembled genomic region (181.9–184.6 Mb, NCBI build 34) contains nine genes (Refseq), including DCUN1D1 and SOX2, and various Genbank mRNAs. This image was downloaded from the UCSC genome browser (http://genome.ucsc.edu/, [64], [65]). The green arrows in panels B and C/D point to BAC clones RPCI11-259I19 and RPCI11-701O19, respectively, corresponding to the maxima of chromosome 3 amplification in these lung SCC cohorts. RPCI11-259I19 and RPCI11-701O19 are mapped, respectively, between the SOX2 and DCUN1D1, and FXR1 and SOX2, genes. Two different clones were found due to the composition of the two arrays (RPCI11-259I19 in our Chr3 array and RPCI11-701O19 in the GSE12280 array). Mapping of the amplification by two independent clones suggest that it is not a clone-derived artifact.

