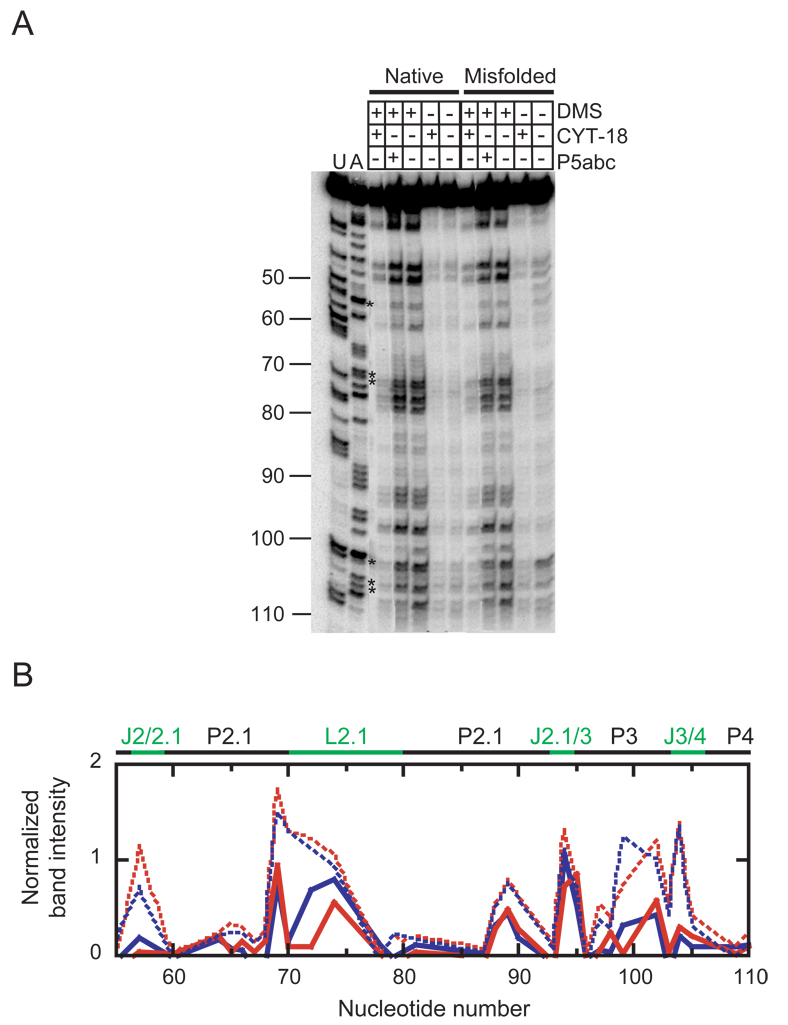
Fig. 8.
DMS footprinting of the native and misfolded ribozyme complexes with CYT-18. A, Gel image of the 5´-region of the ribozyme. B, Quantitation of the region shown in panel A. Data from the native and misfolded ribozyme in complex with CYT-18 are shown as solid blue and red lines, respectively, and data from mixtures of predominantly native and predominantly misfolded ribozyme are shown as dashed blue and red lines, respectively. Asterisks indicate nucleotides that were protected by CYT-18 in both complexes. To correct for differences in loading and for a consistent decrease in labeled material loaded from reactions that included CYT-18, data are shown relative to the fully-extended product and rescaled for simplicity by multiplying these values by 103.

