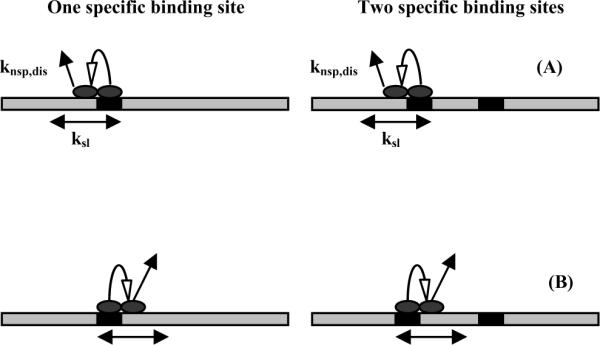
Figure 1.

A schematic representation illustrating the basis for the method for measuring sliding rates. The dissociation reaction starts with a transition from specific to nonspecific binding modes at the recognition sites (the black boxes), followed by a sliding translation to either the left (1a) or right (1b). If recognition sites are considered absorbing barriers and if the walks start from the left, then the probabilities that EcoRI will dissociate from one- and two-site DNA fragments are the same. Starting from the right, however, probabilities will be the same only if the dissociation rate is much faster than the linear diffusion rate. If the sliding rate is much faster than the dissociation rate, the ratio of the dissociation probabilities for the two-site and one-site DNA fragments is 0. The protein will find the second site before dissociating. The ratio of off-rates for complexes with the one-site and two-site DNA fragments will, therefore, vary between 2 and 1 depending on the ratio of the nonspecific complex dissociation rate and the sliding rate.
