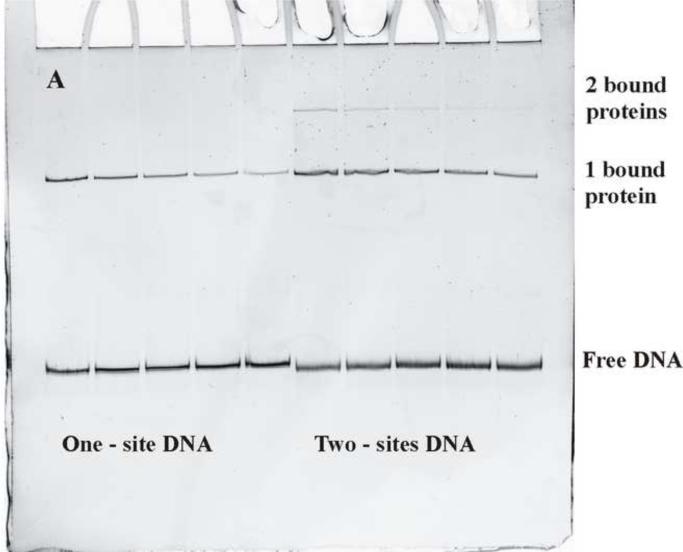
Figure 2.
Dissociation of EcoRI from DNA with one or two recognition site. (a) A typical polyacrylamide gel shows the loss of EcoRI binding to the one-site DNA fragment (the first five lanes) with time and to the two-site DNA fragment (the last five lanes). The one protein bound complex and free DNA bands are indicated. The two-site DNA fragment has an additional weak band of complex with two bound proteins. A large excess of specific site oligonucleotide is added to the EcoRI/DNA fragment mixture to initiate dissociation. Incubation times are 0, 15, 30, 45, and 60 min from left to right. The dissociation reaction is stopped by adding triethylene glycol.
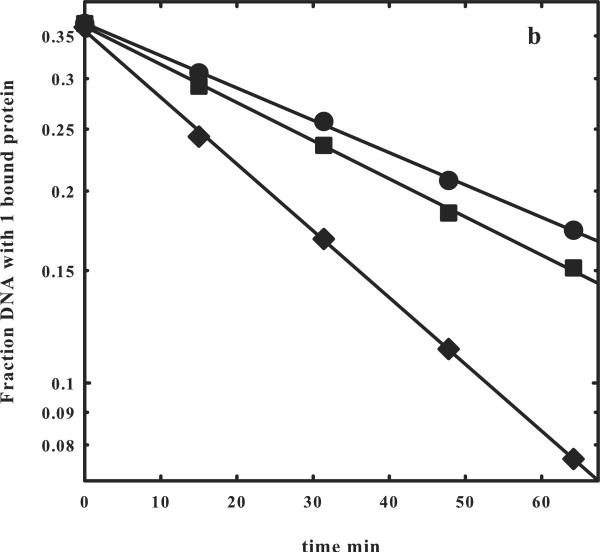
(b) The logarithmic dependences of the fraction of one bound protein complex on time are shown for the one- (◆) and two- (●) site DNA fragments shown in (a). The slopes give the off rates for EcoRI dissociating from the fragments into solution, koff,1-site or koff,2-site. A correction to the fraction of one bound protein complex to account for the contribution from dissociation of the two-site fragment with two bound proteins can be applied using equation (9). The corrected data is shown (■). The observed ratio koff,1-site/koff,2-site = 1.93 indicates that the EcoRI that dissociates from one specific site and begins a random walk in the direction of the other site will almost certainly find the other before dissociating from the fragment into solution (Figure 1b).


