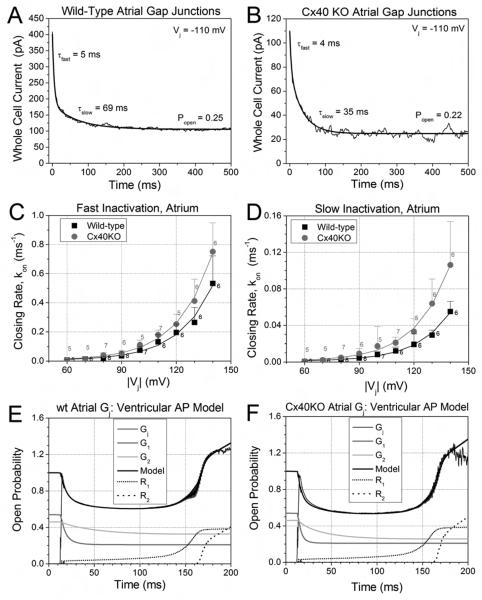
Figure 5.
Inactivation kinetics and dynamic action potential model of atrial gap junctions. A, An example of a whole cell (I2) current during a voltage clamp step to −110 mV from a single wt atrial myocyte experiment. The fast and slow decay time constants (τfast and τslow) were determined by exponential curve fitting of the Ij trace. B, A similar example of the decay time constant (τ) curve-fitting and open probability (Popen) measurements for a Cx40KO atrial Ij recording. C, The average fast inactivation rates (kon, fast mean ± s.d., n = 5-8), for wt and Cx40KO atrial Gj increased exponentially with Vj (voltage constant of 18.6-8 mV). D, The average slow inactivation rates (kon, slow) for wt and Cx40KO atrial Gj similarly increased exponentially with a Vj constant (ν) of 18.1-6 mV. E, Dynamic gap junction model fit of time-dependent wt atrial Gj curve during the BCL = 1 sec ventricular action potential using the kinetic inactivation parameters from panels C and D. The wt atrial Gj model is similar to the previously described ventricular Gj model except that the inactivation kinetics were slower and the early recovery commences sooner [15]. F, Dynamic gap junction model fit of time-dependent Cx40KO atrial Gj curve during the same model ventricular action potential. The Cx40KO atrium had faster inactivation kinetics and slightly more late recovery (R2) than wt atrial Gj

