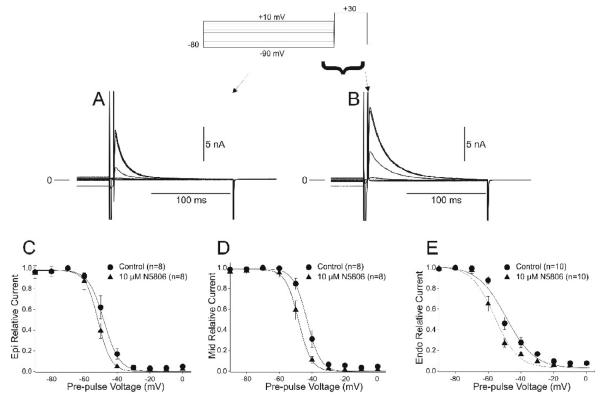
Figure 5.
Representative traces recorded under control conditions (Panel A) and after application of 10 μM NS5806 (Panel B) showing voltage dependence of inactivation of Ito. Boltzmann curves showing mid-inactivation voltages for Epi (Panel C), Mid (Panel D) and Endo (Panel E) cells in the absence and presence of drug.

