
Fig. 2.
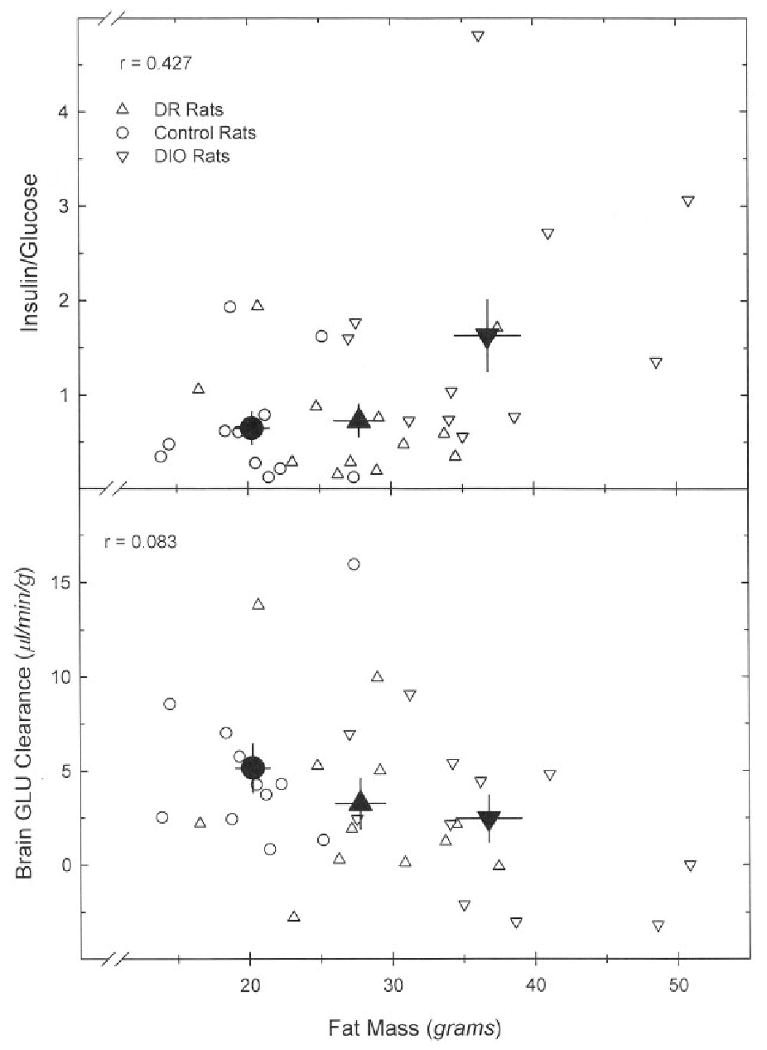
Correlation between fat mass and the plasma insulin/glucose ratio (top panel) and brain GLU clearance (bottom panel). Data points for individual animals are shown as open symbols; filled (black) symbols represent group means; bars are SEM. A linear regression of insuin/glucose vs. fat mass was statistically significant (F = 7.127, P = 0.012), while that of whole brain GLU clearance vs. fat mass was not (F = 2.173, P = 0.150).