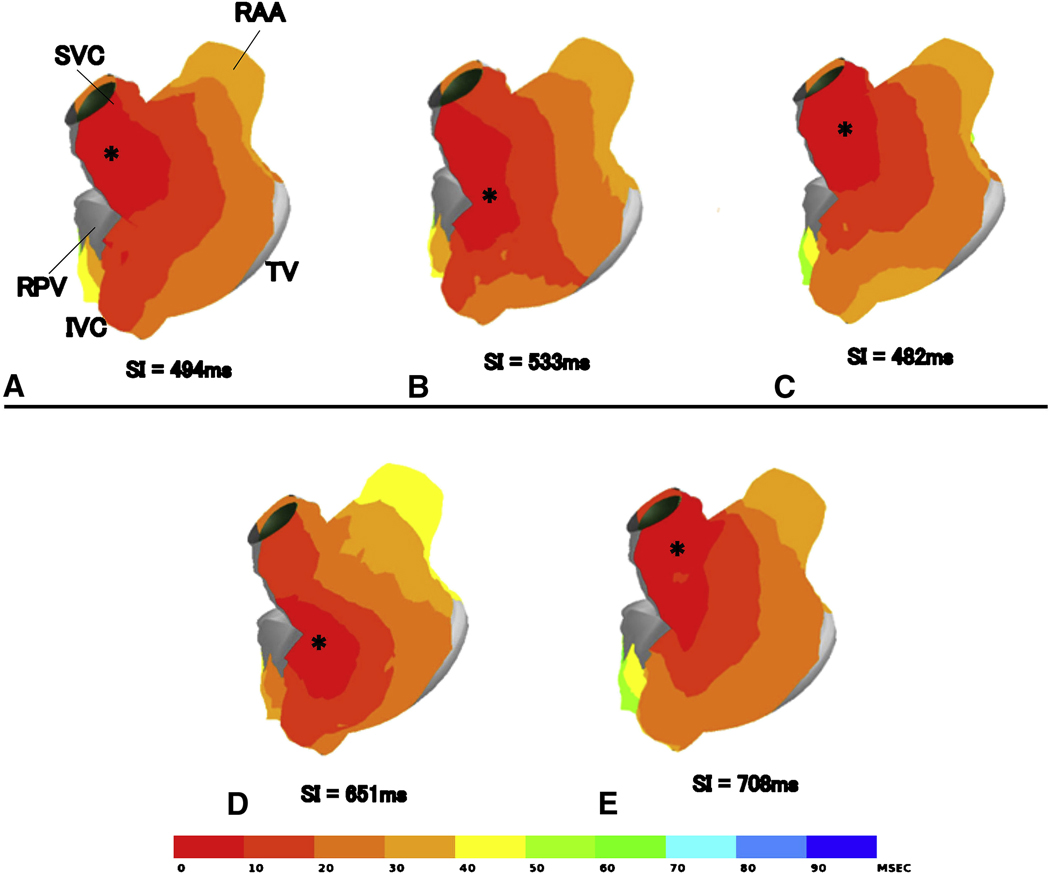
Figure 5.
Upper panel represents the atrial activation maps constructed from sinus rhythm without vagal stimulation (A), with vagal stimulation (B) pre-ablation, and sinus rhythm with vagal stimulation immediately post-ablation. Lower panel represents sinus activation maps without vagal stimulation (D) and with vagal stimulation (E) at 4 weeks in the same animal. The maps represent the lateral view in the right atrium. The asterisks indicate the earliest activation site in the right atrium. The atrial activation is shown with color coding at 10 ms increments. The numbers below the figure indicate the sinus interval time (ms) in the each activation. RAA, right atrial appendage; SVC, superior vena cavae; IVC, inferior vena cavae; TV, tricuspid valve; RPV, right pulmonary vein.

