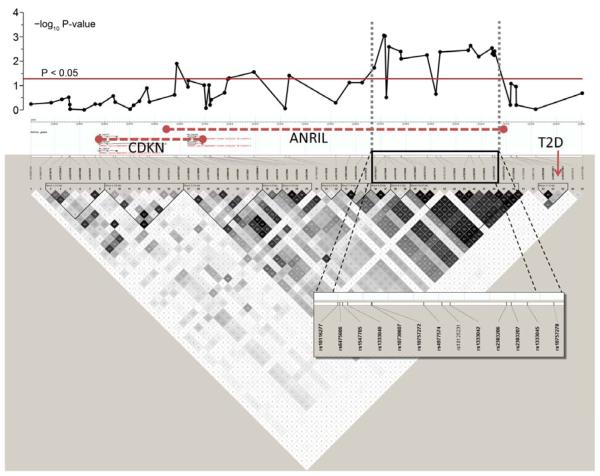
Figure 2. Linkage disequilibrium (LD) plot of 9p21 region.
The upper panel shows negative log10 P-values for the association of the individual SNPs at their physical location with perioperative myocardial injury (PMI), after adjustment in multivariable regression model. The lower panel summarizes the LD structure in the HapMap database (CEU European ancestry). Regions of LD are shaded in grey (moderate LD) or black (strong LD). Predicted haplotype blocks are framed by triangles. The physical location of the genes CDKN2A and 2B and ANRIL are shown in the HapMap info tack above the SNPs. The type 2 diabetes (T2D) locus is seen on the far right side of the LD plot, with a non-significant association with PMI.
CDKN= cyclin dependent kinase
ANRIL= anti-sense non-coding RNA gene
T2D= type 2 diabetes

