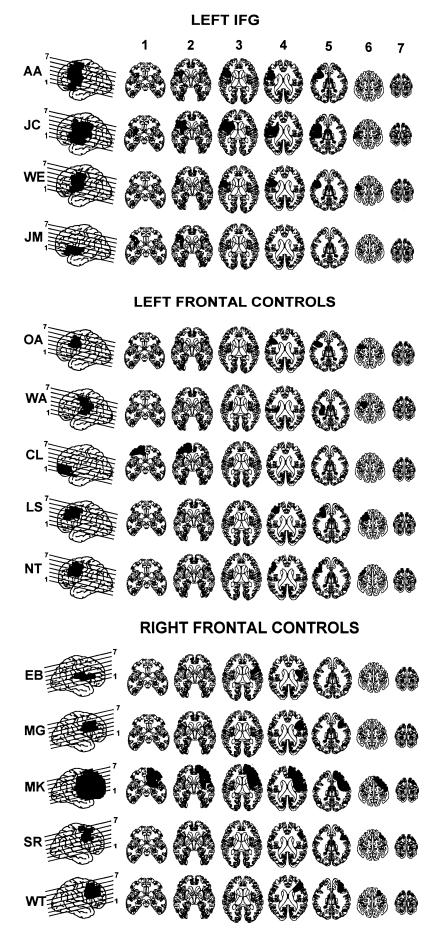
Figure 1.
Reconstructions of lesions based on computerized tomography and MRI scans. For each patient, the lateral view on the far left shows the lesion projected onto the lateral surface of the brain. Lines through the lateral projection show the level of the axial cuts from ventral (1) to dorsal (7). Patients were categorized into three groups based on the locations of the lesions: Patients with left frontal lesions that extended into the IFG (BA 44; Top); patients with left frontal lesions sparing BA 44 (Middle); and patients with right frontal lesions (Bottom).

