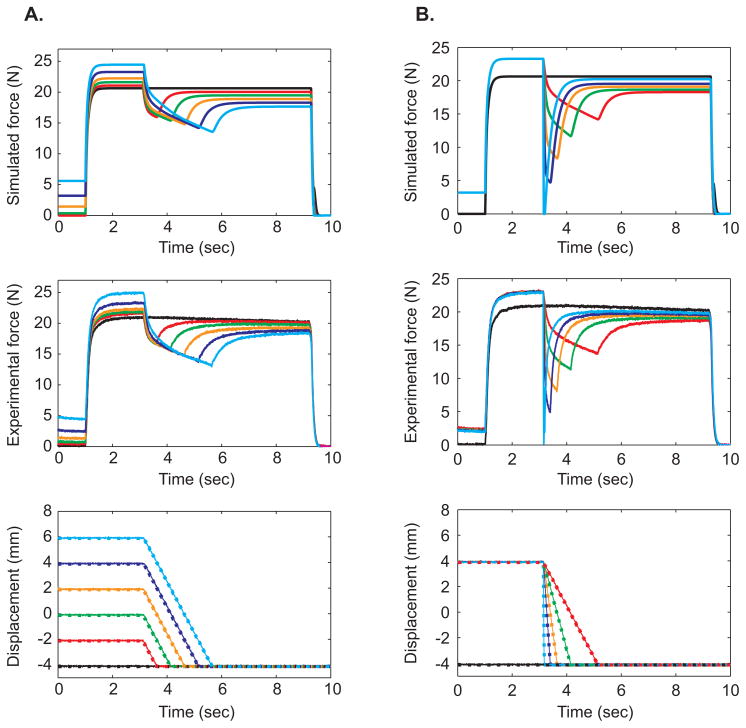
Figure 3.
Simulated (top row) and experimental (middle row) data from A) constant velocity and B) variable velocity in situ experiments. Muscles were fully activated at 1 sec and deactivated ~ 9.5 sec. The constant velocity experiments were conducted at -4mm s−1 and shortened 2, 4, 6, 8 and 10 mm. Variable velocity experiments were conducted at 4, 8, 16, 32 and 256 mm s−1 with a fixed displacement of 8 mm. Simulated displacements (large dashed lines) and plotted over experimental displacements (thin lines) are plotted in the same graphs (bottom row).

